
JAMB - Chemistry (1989 - No. 45)
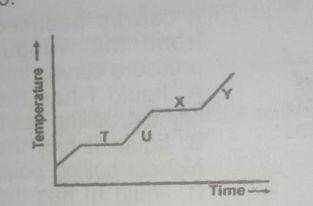
The above graph shows a typical heating curve from the solid phase through the liquid phase to the gaseous phase of a substance. Which part of the curve shows solid and liquid in equilibrium?
T
U
X
Y
Пояснення
point T shows solid-liquid equilibrium. At this point, the substance been heated has begun to melt but has not completely melted forming a solid liquid mixture.