
JAMB - Chemistry (2005 - No. 42)
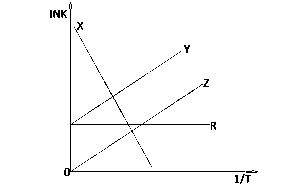
In the diagram above which of the curves illustrates Arrhenius' law?
Y
Z
R
X
Paliwanag
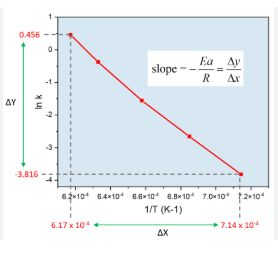
The graphical representation of the Arrhenius equation, which describes the temperature dependence of reaction rates, involves plotting the natural logarithm of the rate constant (ln k) against the inverse of the absolute temperature (1/T), resulting in a straight line with a slope of -Ea/R and a y-intercept of ln A.
(See an example above)