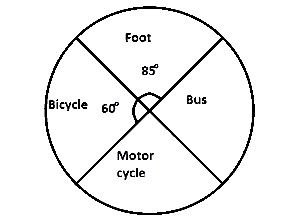
The pie chart above show the distribution of how students travelled to a certain school on a particular day. Use this information to answer the question below
What percentage, to the nearest whole number, of tghe students travelled to school on foot?