Mathematics for IGCSE & O level - Statistical Diagrams (Section 1)
1
What does the vertical scale represent in a histogram?
2
What does the term 'class width' refer to in a histogram?
Jibu(B)
The range of values in each group.
3
What is the interquartile range?
Jibu(C)
Upper Quartile - Lower Quartile
4
what is the relationship between frequency density, frequency, and class width?
Jibu(B)
Frequency = Frequency Density x Class Width
5
What is the relationship between cumulative frequency and the total number of data points?
Jibu(B)
It increases until it equals the total number of data points.
6
What type of data is used to make a cumulative frequency table?
7
If a histogram is skewed to the right (positively skewed), what is likely to be true?
Jibu(C)
The mean will be greater than the median.
8
If the cumulative frequency diagram shows a steep curve, what does it indicate about the data?
Jibu(B)
The data is clustered around a few values.
9
Which of the following would be the most appropriate to show the relationship between the hours studied and the test scores achieved?
10
When creating a cumulative frequency table, what is the correct way to calculate the cumulative frequency?
Jibu(C)
Adding each frequency to the sum of the frequencies above it.
11
Which of the following diagrams is suitable for displaying continuous data?
12
How do you find the number of data points above a certain value using a cumulative frequency diagram?
Jibu(A)
Find the cumulative frequency corresponding to that value and subtract it from the total.
13
Which of the following can be used to display data?
14
When interpreting a histogram, how can you identify the mode (or modal class)?
Jibu(A)
It is the interval with the highest frequency density.
15
what is a cumulative frequency?
Jibu(B)
The total of the frequencies up to and including a particular group.
16
What does a bimodal distribution look like on a histogram?
17
Which of the following is NOT a key component of a histogram?
18
What is the main use of cumulative frequency diagrams?
Jibu(A)
To determine the median, quartiles, and spread of the data.
19
Which of the following is NOT a step in creating a cumulative frequency diagram?
Jibu(D)
Drawing a line of best fit through the midpoints of the bars.
20
If a histogram shows a symmetrical distribution, what can be inferred about the mean and median?
Jibu(C)
The mean and median are approximately equal.
21
what is a characteristic of negative correlation?
Jibu(B)
Data points go from top left to bottom right
22
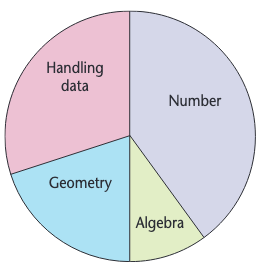
Based on the pie chart below, which topic has the largest angle?
23
What can the 'range' of data be considered?
24
What information can be best displayed using a scatter diagram?
Jibu(B)
The relationship between two variables
25
Which of the following is a characteristic of a histogram?
26
What can a cumulative frequency diagram be used to estimate about the data?
27
What does the area of each bar represent in a histogram?
28
What type of diagram is used to represent the distribution of data using frequency density?
29
In a histogram, the frequency density represents:
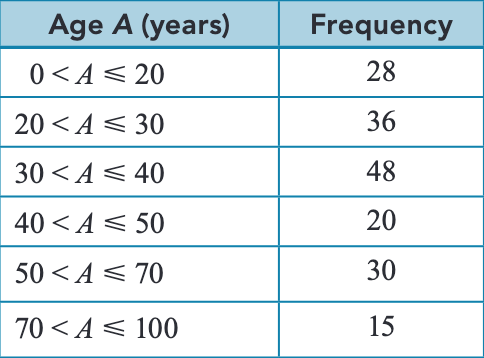
30
According to the table below, what is the frequency for the 50 ≤ A < 70 age range?
31
In a histogram, which characteristic is represented by the area of each bar?
32
Which of the following is an example of a measure of spread?
33
What is the relationship between the cumulative frequency and the frequency?
Jibu(A)
The cumulative frequency is the total of all frequencies up to and including the current interval.
34
What is the shape of a cumulative frequency diagram?
Jibu(D)
A curved line that increases and then plateaus
35
If a data set has a mean of 50 and a median of 40, what type of skewness is likely present?
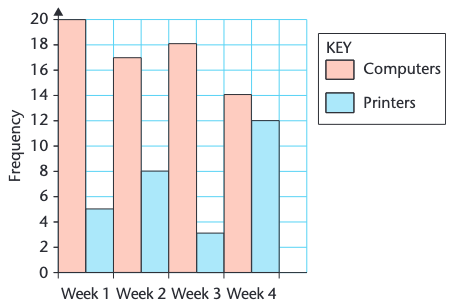
36
What is the difference in computer sales between Week 1 and Week 4?
37
In the context of a cumulative frequency diagram, how is the lower quartile determined?
Jibu(A)
By finding the x-axis value at 25% of the total frequency.
38
What does the height of each bar in the histogram represent?
39
What does the area of each bar in a histogram represent?
Jibu(A)
The frequency of that class
40
What is the purpose of a line of best fit in a scatter diagram?
Jibu(C)
To estimate a value when only one pair of values is known.
41
What are the units of frequency density?
42
What is the relationship between class width and frequency density in a histogram?
Jibu(C)
They are inversely proportional.
43
In a cumulative frequency diagram, how is the upper quartile found?
Jibu(B)
By finding the x-axis value corresponding to the 75th percentile.
44
What information is displayed by the x-axis and y-axis in a cumulative frequency diagram, respectively?
Jibu(C)
Data values, cumulative frequency
45
What is calculated by dividing the frequency by the class width?
46
What does the 25th percentile represent?
47
What is the purpose of using frequency density in a histogram?
Jibu(B)
To accommodate class intervals of varying widths.
48
In which situation is a histogram particularly helpful?
Jibu(B)
When the data is grouped and continuous.
49
What type of correlation exists when, as one variable increases, the other variable decreases?
50
What is used to display large sets of grouped, continuous data?