
ExamPlay Dark Logo
Prihlásiť sa

WAEC - Geography (2019 - No. 13)
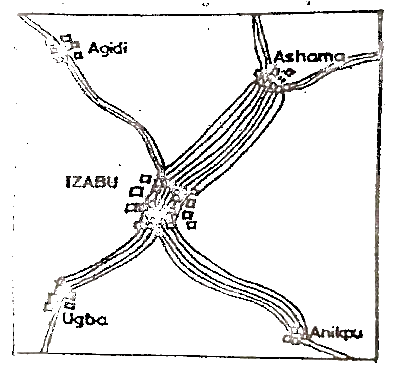
The image below shows the volume and direction of passenger traffic between IZABU town and its surrounding towns in the year 2001.

Scale: 1 line represents 1,500 persons

The image below shows the volume and direction of passenger traffic between IZABU town and its surrounding towns in the year 2001.

Scale: 1 line represents 1,500 persons

The image below shows the volume and direction of passenger traffic between IZABU town and its surrounding towns in the year 2001.

Scale: 1 line represents 1,500 persons

By how much is the traffic between IZABU and Anikpu more than the traffic between IZABU and Ugba?

1,200
1,500
1,700
1,800

Pripomienky (0)

Ak chcete komentovať, prihláste sa
Reklama
BrainBehindX Inc Logo
©2026; Beží na BrainBehindX Inc