Войти
WAEC - Geography (2016 - No. 11)
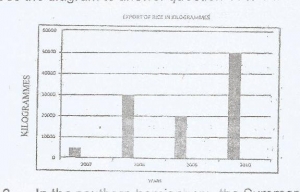
The diagram above represents the export of rice in Kilogrammes from Country X between 2007 and 2010.
What is the name of the diagram above?
Line graph
Bar graph
Pie Chart
Star graph
Комментарии (0)
Войдите, чтобы оставить комментарий
Реклама
Разрешить JavaScript для правильной загрузки этой страницы