Mathematics for IGCSE & O level - Statistical Diagrams (Section 6)
1
In a cumulative frequency graph, how do you estimate the median?
Отвечать(C)
Find the value on the x-axis corresponding to the cumulative frequency that is half the total frequency.
2
What does a steep slope in a cumulative frequency diagram indicate about the data?
Отвечать(A)
A high frequency of data values within that interval.
3
What is calculated first before drawing a histogram?
4
What is true about cumulative frequency diagrams?
5
What is the name given to the 25th percentile of a data set?
6
In a histogram, what does the y-axis label represent?
7
Which of the following is a benefit of using the median?
8
Which of the following is a benefit of representing data with a box plot?
Отвечать(D)
It clearly displays the median, quartiles, and outliers.
9
If the frequency density in a histogram is constant, then which of the following is true?
Отвечать(B)
The class intervals are equally wide.
10
If a scatter diagram shows a strong negative correlation, what would you expect to see?
Отвечать(B)
The points forming a clear downward slope.
11
What does it mean if the standard deviation of a dataset is low?
Отвечать(B)
The data points are closely clustered around the mean.
12
What is the range of a dataset, given the smallest value is 10 and the largest value is 50?
13
The interquartile range (IQR) is a measure of...
Отвечать(A)
the spread of the middle 50% of the data.
14
What are the key properties of a scatter diagram?
15
If the class width doubles, what is the impact on the frequency density?
16
Which measure of central tendency is most affected by outliers?
17
When using a cumulative frequency diagram, what does the intersection of the line and the 50% mark indicate?
18
In a positively skewed distribution, which statement is generally TRUE?
19
In a symmetrical distribution, what is the relationship between the mean, median, and mode?
20
What is the main purpose of using a histogram?
Отвечать(B)
To display the frequency distribution of continuous data
21
What is the relationship between frequency, class width, and frequency density in a histogram?
Отвечать(C)
Frequency = Frequency Density * Class Width
22
What does the term 'outlier' refer to?
Отвечать(B)
A value that is significantly different from the other values in a dataset.
23
What measure of central tendency is most resistant to the effects of outliers?
24
What is the primary purpose of a histogram?
Отвечать(B)
To display the frequency distribution of continuous data.
25
Which is a more informative way to compare two datasets?
Отвечать(C)
A back-to-back stem and leaf.
26
Which of the following is represented by the area of each bar in a histogram?
27
What does the term 'skewness' refer to in statistics?
Отвечать(B)
The symmetry of a dataset.
28
What is the 25th percentile also known as?
29
What is the interquartile range?
Отвечать(B)
The difference between the upper and lower quartiles
30
The area of a bar in a histogram represents:
Отвечать(A)
The frequency of the corresponding class interval.
31
If the data is evenly distributed, what will be true about the quartiles in the data?
Отвечать(B)
The distance from Q1 to the median is equal to the distance from the median to Q3.
32
What is the primary use of a cumulative frequency diagram?
Отвечать(C)
To estimate the median and quartiles.
33
What information is typically displayed on the y-axis of a cumulative frequency graph?
34
Which of the following correctly states the relationship between frequency and class width when using a histogram?
Отвечать(C)
Frequency = Frequency Density * Class Width
35
What does the shape of a cumulative frequency graph show?
Отвечать(B)
The spread and skewness of the data.
36
How are the upper and lower quartiles related?
Отвечать(C)
They define the middle 50% of the data.
37
If the line of best fit on a scatter diagram slopes downwards, what type of correlation is indicated?
38
In a survey of 200 people, how many people said that blue was their favorite color?
39
If a data set has many values clustered at the lower end with a few extremely high values, this data is:
40
What is the benefit of using the mode as a measure of central tendency?
Отвечать(D)
It identifies the most frequent value, even with non-numerical data.
41
If the mean is less than the median, what type of skewness is present?
42
If the mean of a dataset is 50 and the median is 60, what can you infer about the data's skewness?
Отвечать(B)
The data is skewed to the left.
43
What does a flat or horizontal portion of a cumulative frequency diagram indicate?
Отвечать(C)
There are no observations in that interval.
44
When the distribution is symmetrical, what can be said about the median and the mean?
45
Which of the following is the correct formula for frequency density?
46
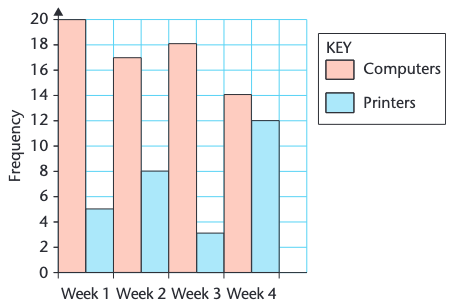
What is the total number of students shown in the chart below?
47
The lower quartile is to the 25th percentile, as the upper quartile is to the:
48
What is the purpose of a tree diagram?
Отвечать(C)
To show possible outcomes and their probabilities
49
If the data distribution is skewed to the left, what is generally true about the mean, median, and mode?
50
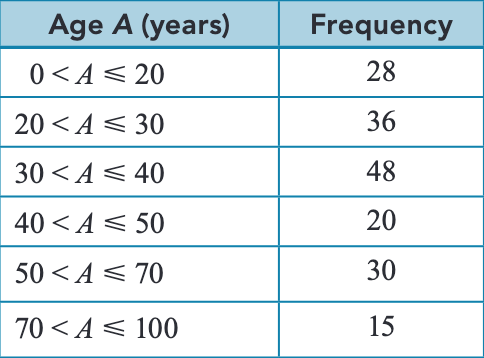
What is an estimate of the number of people aged between 60 and 80?