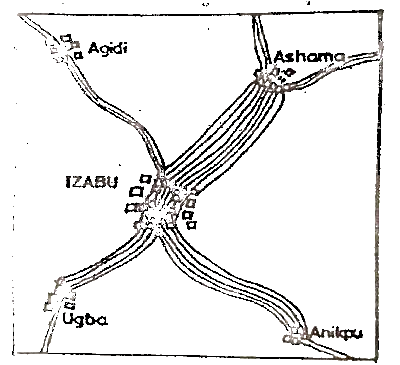
The image below shows the volume and direction of passenger traffic between IZABU town and its surrounding towns in the year 2001.
Scale: 1 line represents 1,500 persons
Which of the following statistical methods is represented above?