Sign In
WAEC - Geography (2016 - No. 11)
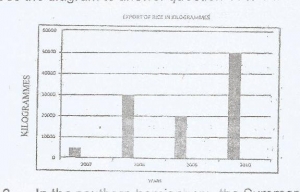
The diagram above represents the export of rice in Kilogrammes from Country X between 2007 and 2010.
What is the name of the diagram above?
Line graph
Bar graph
Pie Chart
Star graph
Comments (0)
Login To Comment
Advertisement
Allow javascript to properly load this page