JAMB - Mathematics (2004 - No. 45)
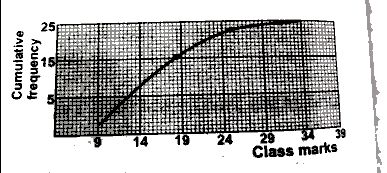
The graph above shows the cumulative frequency curve of the distribution of marks in a class test. What percentage of the students scored more than 20 marks?
68%
40%
17%
8%
Explanation
| class mark x | Cumulative. frequency | frequency |
| 9 | 1 | 1 |
| 14 | 6 | 5 |
| 19 | 15 | 9 |
| 24 | 17 |
2 ↓ |
| 29 | 24 |
7 ↓ |
| 34 | 25 |
1 ↓ |
Total frequency = 25.
% students scoring over 20 marks = \(\frac{10}{25}\) x 100% = 40%
y-axis (Scale of the graph: 1cm to 0.5 units)
NOTE: (frequency of scores greater than 20 starts from 2 and ends at 1)
(To get frequency, subtract the cumulative frequency from down to upward)