Sign In
JAMB - Economics (2006 - No. 44)
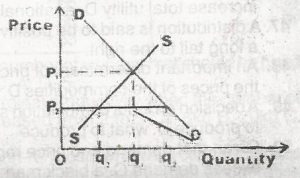
The diagram above shows the effect of
excess demand over supply at q
3
excess supply over demand at q
2
minimum price legislation at P
2
maximum price legislation at P
2
Comments (0)
Login To Comment
Advertisement
Allow javascript to properly load this page