JAMB - Economics (2002 - No. 45)
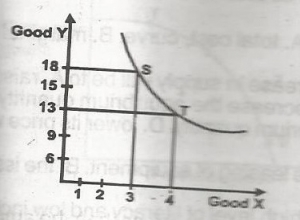
In the diagram above, the marginal rate of substitution of X for Y, for a movement from S to T is
13:3
1:5
18:4
5:1
Explanation
To produce 18 units of Y, at point S, 3 units of X was produced at the same point S. A movement along the production chart from point S to T, the firm gave up 5 units of Y to produce 4 units of X. This means that the firm gave up 5 units of product Y to produce 1 additional unit of X.
The ratio of substitution is 5:1