Sign In
JAMB - Economics (1984 - No. 40)
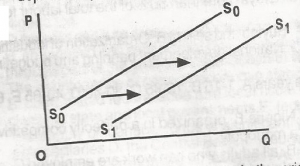
In the diagram, the supply curve So So shifts to a new position S
1
S
1
to indicate
a drop in supply
a rise in supply
a supply- push inflation
a stable supply curve
an increase in quantity supplied
Comments (0)
Login To Comment
Advertisement
Allow javascript to properly load this page