JAMB - Chemistry (2025 - No. 34)
From the graph, it can be inferred that
Explanation
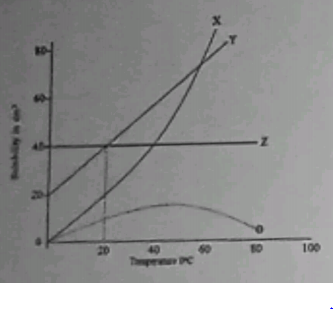
The correct inference from the graph is that solubility of Y increases steadily as temperature increases- option D.
A. the solubility of X and Y is the same at all temperature: Incorrect. The lines for X and Y cross at a single temperature (~50°C), but at all other temperatures, their solubilities are different (e.g., Y is more soluble below ~50°C, X is more soluble above ~50°C).
B. the solubility of X, Y and Z is temperature dependent: Incorrect. The line for Z is horizontal, indicating that its solubility is constant and does not change with temperature.
C. solubility of Z increases as temperature increases: Incorrect. The horizontal line for Z shows that its solubility remains the same as the temperature increases.
However, in option D, the solubility of Y increases steadily as temperature increases. This statement is Correct. Following the line for Y from left to right (increasing temperature), the line moves upwards, indicating a steady increase in solubility.