Sign In
JAMB - Chemistry (1984 - No. 40)
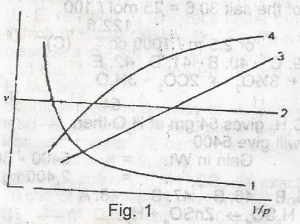
Which of the curves shown in the figure given represents the relationships between the volume(V) and pressure(P) of an ideal gas at constant temperature
1
2
3
4
1 and 3
Comments (0)
Login To Comment
Advertisement
Allow javascript to properly load this page