WAEC - Mathematics (2000 - No. 18)
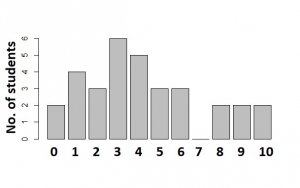
The bar chart shows the distribution of marks scored by a group of students in a test. Use the chart to answer the question below
How many students scored 4 marks and above?
15
11
10
17
Uitleg
Students that scored 4 and above = 5 + 3 + 3 + 0 + 2 + 2 + 2
= 17