
JAMB - Economics (2011 - No. 38)
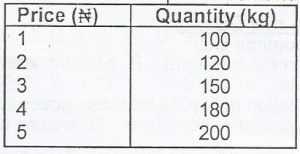
The graph of the schedule above will depict
a kinked demand curve
a normal demand curve
an abnormal demand curve
a diminishing marginal utility curve
설명
It depicts an abnormal demand. This is a kind of demand that is contrary to the conventional Law of demand:(the higher the price, the lower the quantity demanded and the lower the price, the higher the quantity demanded). From the schedule above, at a price of N1, the quantity demanded was 100 units while as the price rose to N5, the quantity demanded also increased to 200 units.
The abnormal demand curve is the demand curve that has a positive slope. That is, an increase in price causes a rise in quantity demanded, and a decrease in prices cause a fall in quantity demanded.