
WAEC - Chemistry (2015 - No. 28)
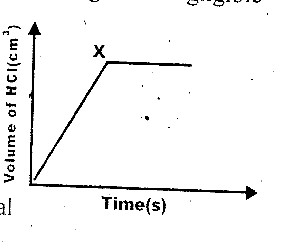
The following diagram illustrates the rate curve that was obtained when Mg reacted with excess dilute HCl.
The diagram became horizontal at X because
The reaction was slowed down
All the dilute HCl has reacted
All the Mg has reacted
Hydrogen gas is produced at a steady rate