サインイン
WAEC - Geography (2016 - No. 11)
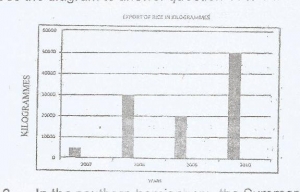
The diagram above represents the export of rice in Kilogrammes from Country X between 2007 and 2010.
What is the name of the diagram above?
Line graph
Bar graph
Pie Chart
Star graph
コメント (0)
コメントするにはログインしてください
広告
JavaScript がこのページを適切にロードできるようにします