Registrazione
WAEC - Mathematics (2007 - No. 60)
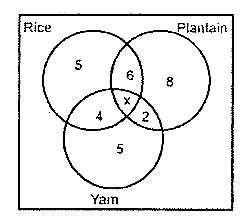
The venn diagram shows the choice of food of a number of visitors to a canteen. If there were 35 visitors in all, find the value of x
5
4
3
2
Spiegazione
5 + 6 + 4 + 8 + 5 + 2 + x = 35
30 + x = 35
x = 35 - 30
x = 5
Commenti (0)
Accedi per commentare
Annuncio
Consenti a JavaScript di caricare correttamente questa pagina