WAEC - Mathematics (2012 - No. 41)
6.0
3.0
2.4
1.8
Selitys
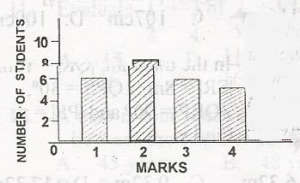
\(\begin{array}{c|c} x & f & fx\\ \hline 1 & 6 & 6 \\
2 & 8 & 16\\ 3 & 8 & 18\\ 4 & 5 & 20\end{array}\)
mean x = \(\frac{\sum fx}{\sum f}\)
= \(\frac{60}{25}\)
x = 2.4
2 & 8 & 16\\ 3 & 8 & 18\\ 4 & 5 & 20\end{array}\)
mean x = \(\frac{\sum fx}{\sum f}\)
= \(\frac{60}{25}\)
x = 2.4