Είσοδος
WAEC - Geography (2016 - No. 11)
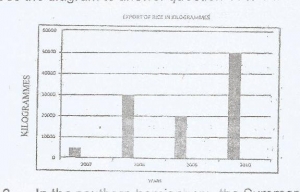
The diagram above represents the export of rice in Kilogrammes from Country X between 2007 and 2010.
What is the name of the diagram above?
Line graph
Bar graph
Pie Chart
Star graph
Σχόλια (0)
Είσοδος για σχόλιο
Διαφήμιση
Επιτρέψτε στη javascript να φορτώσει σωστά αυτήν τη σελίδα