
WAEC - Economics (2020 - No. 8)
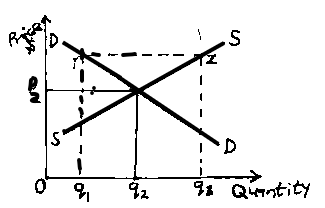
In the figure above, YZ represents
excess demand
excess supply
equilibrium quantity
equilibrium price
Erläuterung
Demand and supply were at equilibrium at points P\(_{2}\) and q\(_{2}\). At point YZ, supply is in excess