
JAMB - Economics (2022 - No. 76)
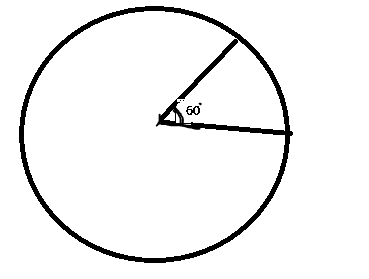
The pie chart above represents the total population of a school of 1,200. The shaded area of 60º shows the population of the underaged pupils.
What is the population of the matured students?
600
800
1000
1200
Erläuterung
Population of underaged student = \(\frac{60}{360}\) x 1200
= 200
Population of matured student = 1200 - 200 = 1000.