Log ind
WAEC - Mathematics (2012 - No. 40)
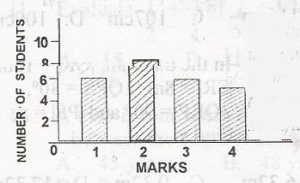
The bar chart shows the frequency distribution of marks scored by students in a class test. How many students are in the class?
10
24
25
30
Forklaring
6 + 8 + 6 + 5 = 25
Kommentarer (0)
Log ind for at kommentere
Reklame
Tillad, at javascript indlæser denne side korrekt