
JAMB - Economics (2017 - No. 34)
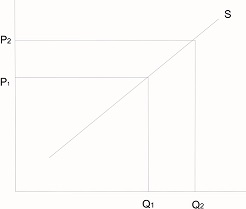
The graph above shows;
a decrease in quantity supplied
an increase in supply
a decrease in supply
an increase in quantity
Forklaring
From the graph above, there is a direct relationship between price and quantity supplied. As the price goes up, the quantity supplied also rises. But as price falls, so too does quantity supplied. When the price was P1, the supplier was willing to supply only one unit of his product. When the price increased to P2, the supply also increased.
The graph represents a “normal” supply curve, showing that as price changes, it brought about a change to quantity supplied.