
JAMB - Economics (2023 - No. 74)
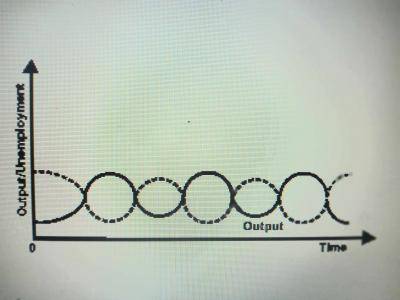
The diagram above represent
structural unemployment
cyclical unemployment
volunatary unempployment
frictional unemployment
Explicació
The dotted line in the graph above represent the upturn and downturn of the econonmy. Therefore, the diagram is cyclical unemployment.