
JAMB - Economics (2017 - No. 9)
a decrease in quantity supplied
an increase in supply
a decrease in supply
an increase in quantity supplied
Explicació
There is an increase in the quantity supplied if the quantity supplied increases as a result of an
increase in price of the commodity.
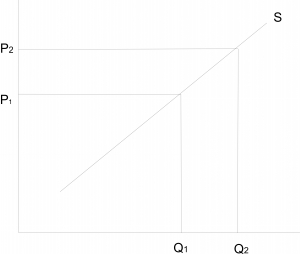
From the graph, an increase in the price of the commodity from p1 to p2 brought about a
corresponding increase in quantity supplied from q1 to q2.
increase in price of the commodity.
From the graph, an increase in the price of the commodity from p1 to p2 brought about a
corresponding increase in quantity supplied from q1 to q2.